01
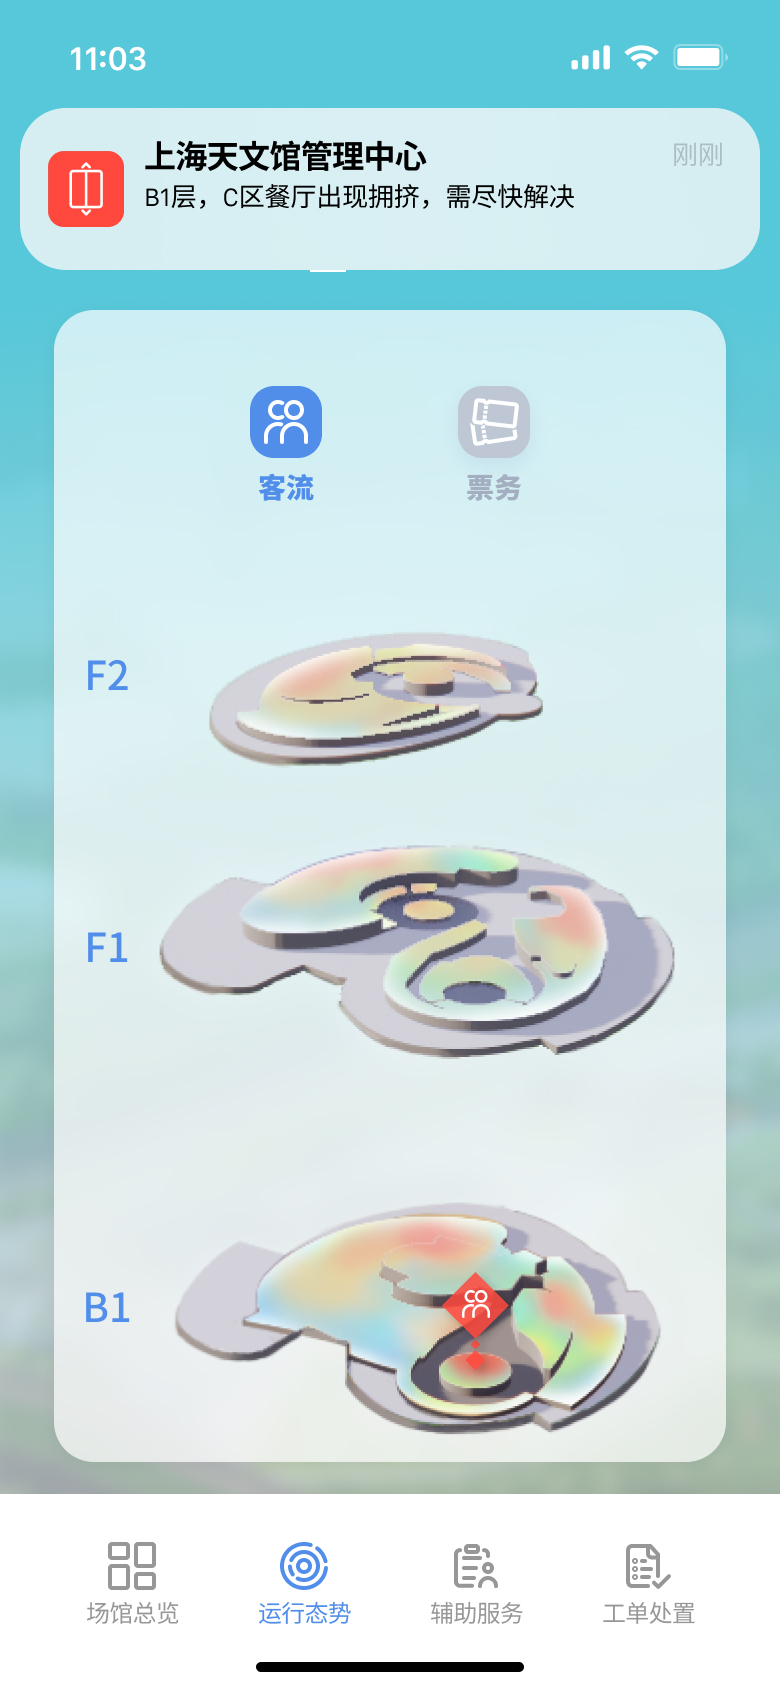
用 3D 模型锚定空间
Anchoring Data to Physical Space
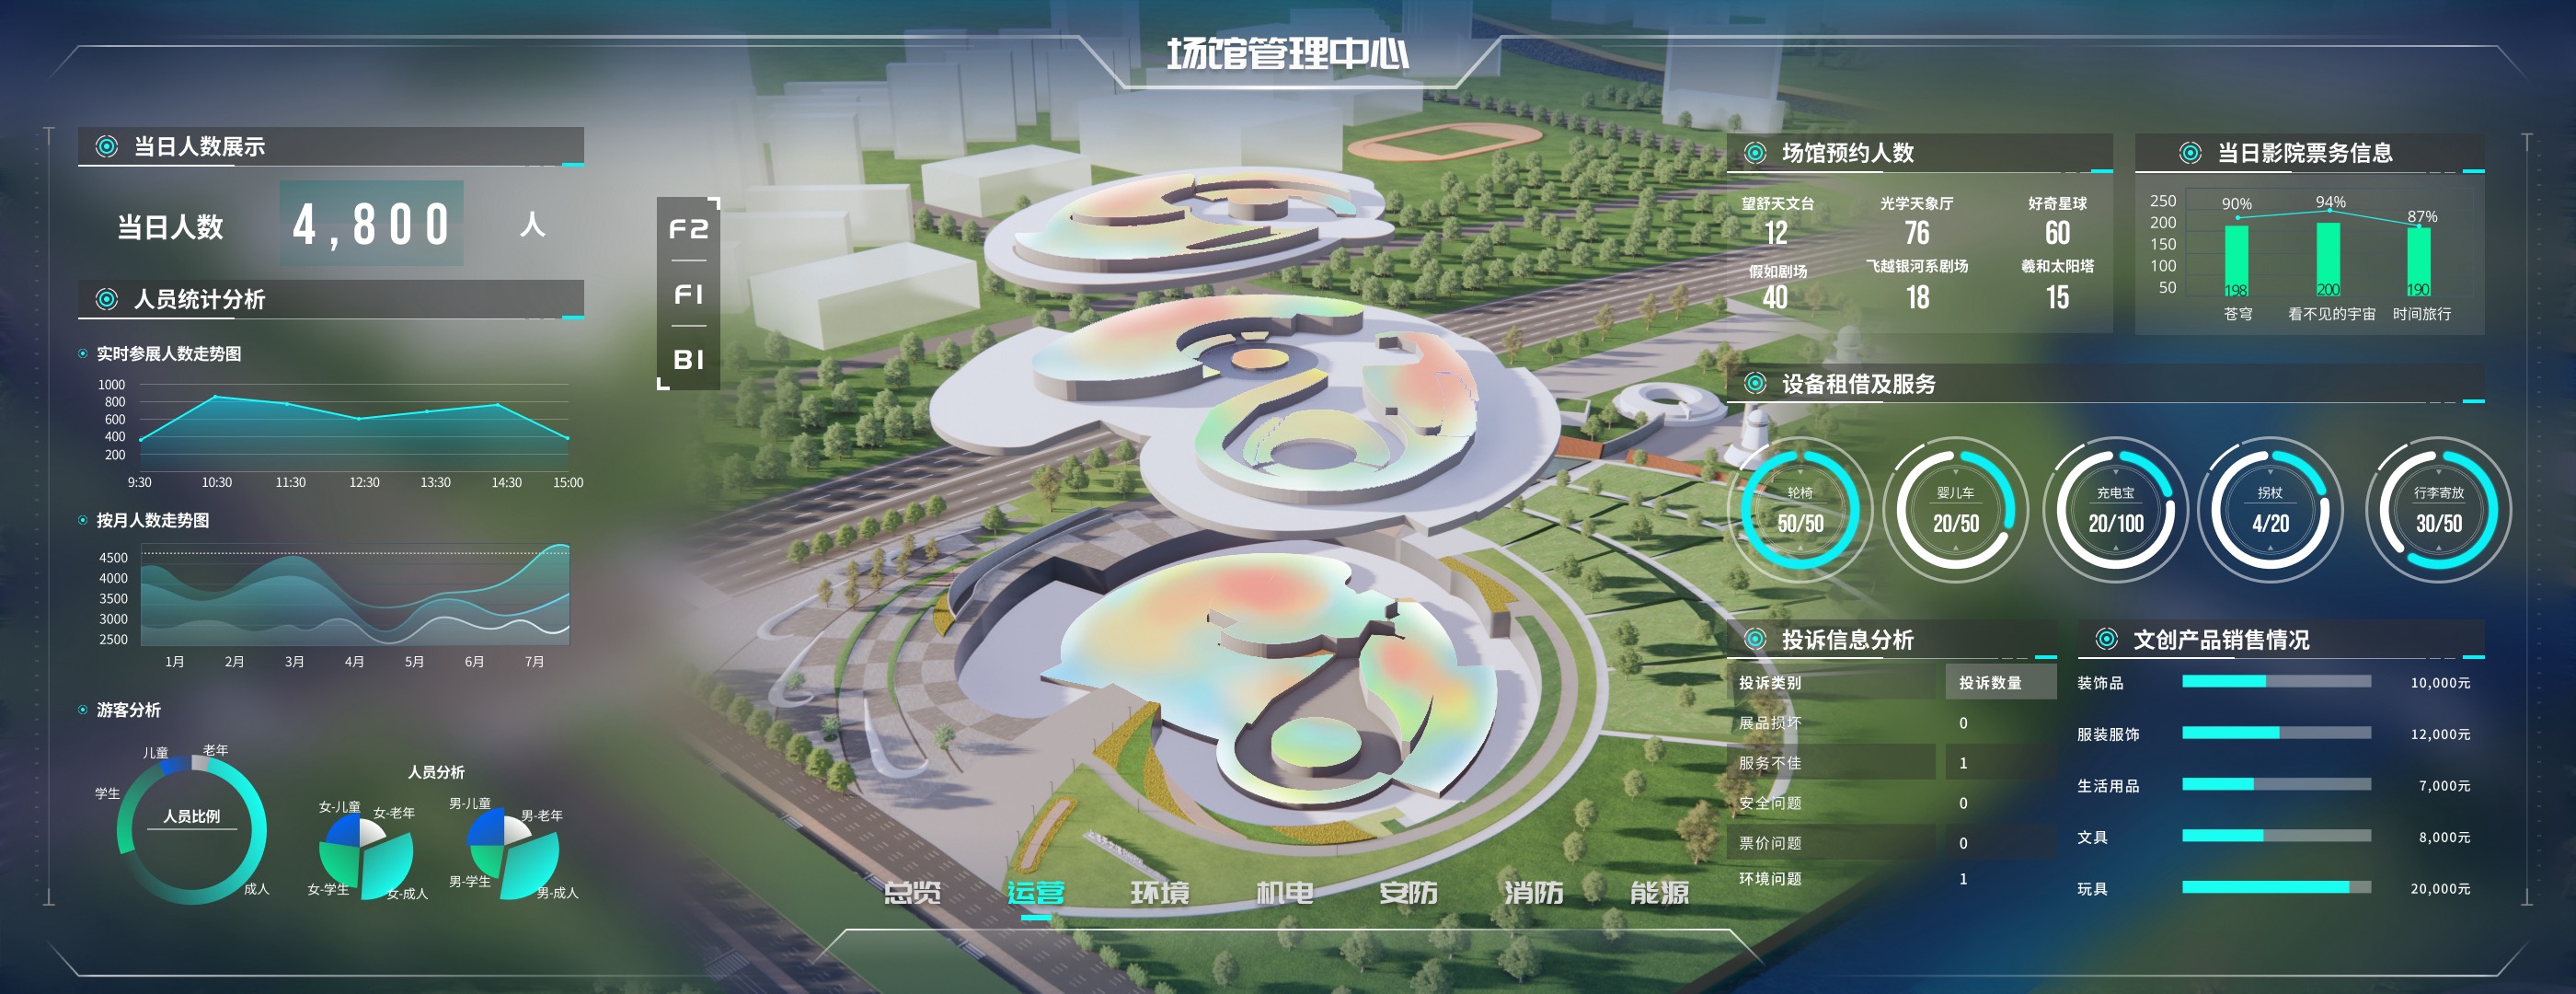
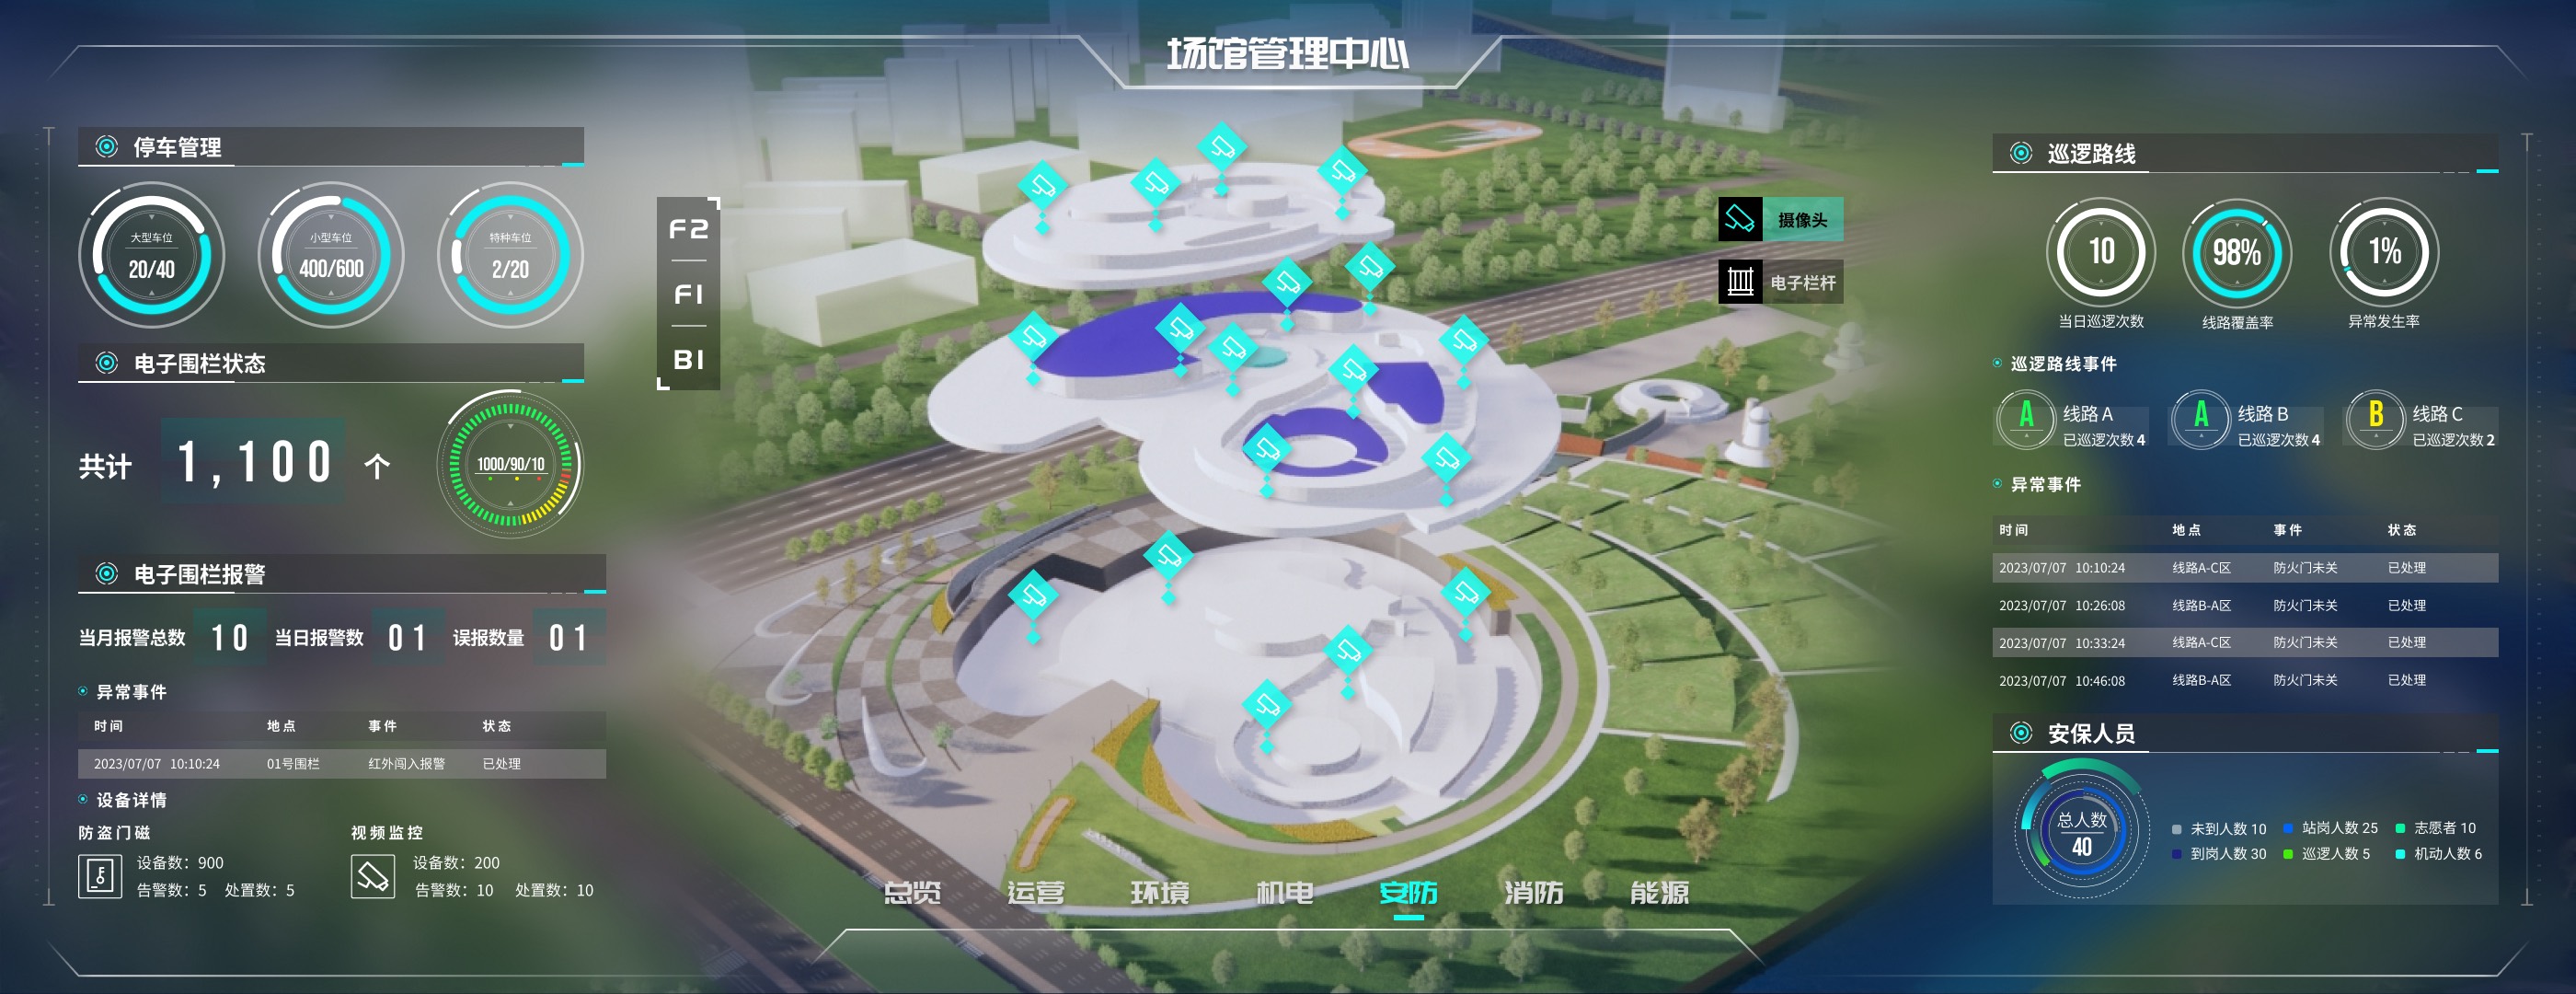
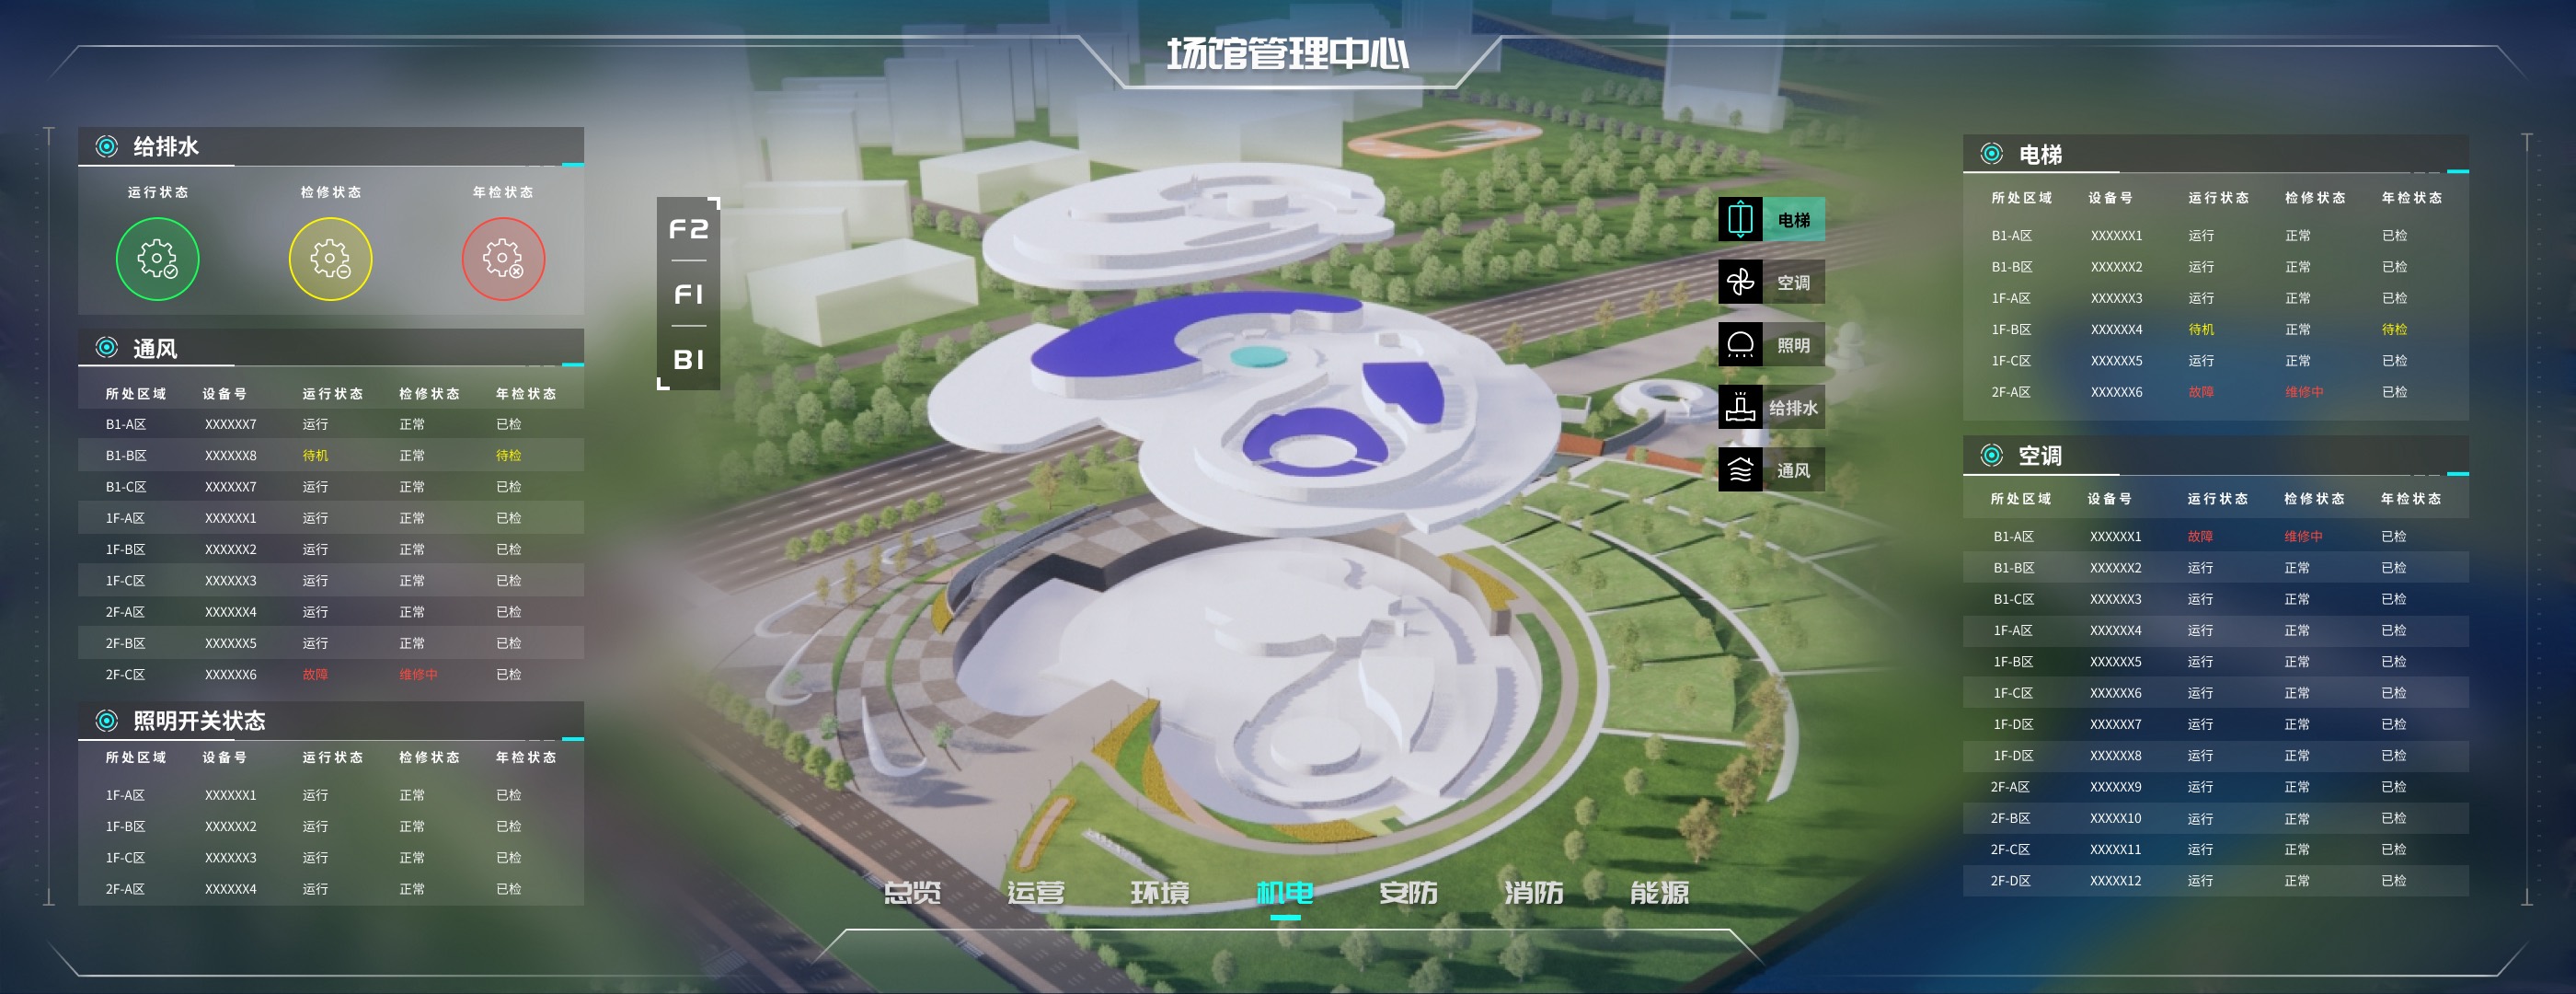
场馆有 B1、F1、F2 三个楼层,平面地图无法同时表达楼层关系和空间位置。3D 模型配合楼层切换控件,让每个数据点对应到建筑中的实际位置。
The museum spans three floors (B1, F1, F2), with cameras, fire sensors, and HVAC units distributed across all of them. A flat map can't express floor relationships and spatial positions simultaneously. The 3D model, paired with a floor-switching control, ties each data point to its physical location, making it immediately clear where an issue is.
02
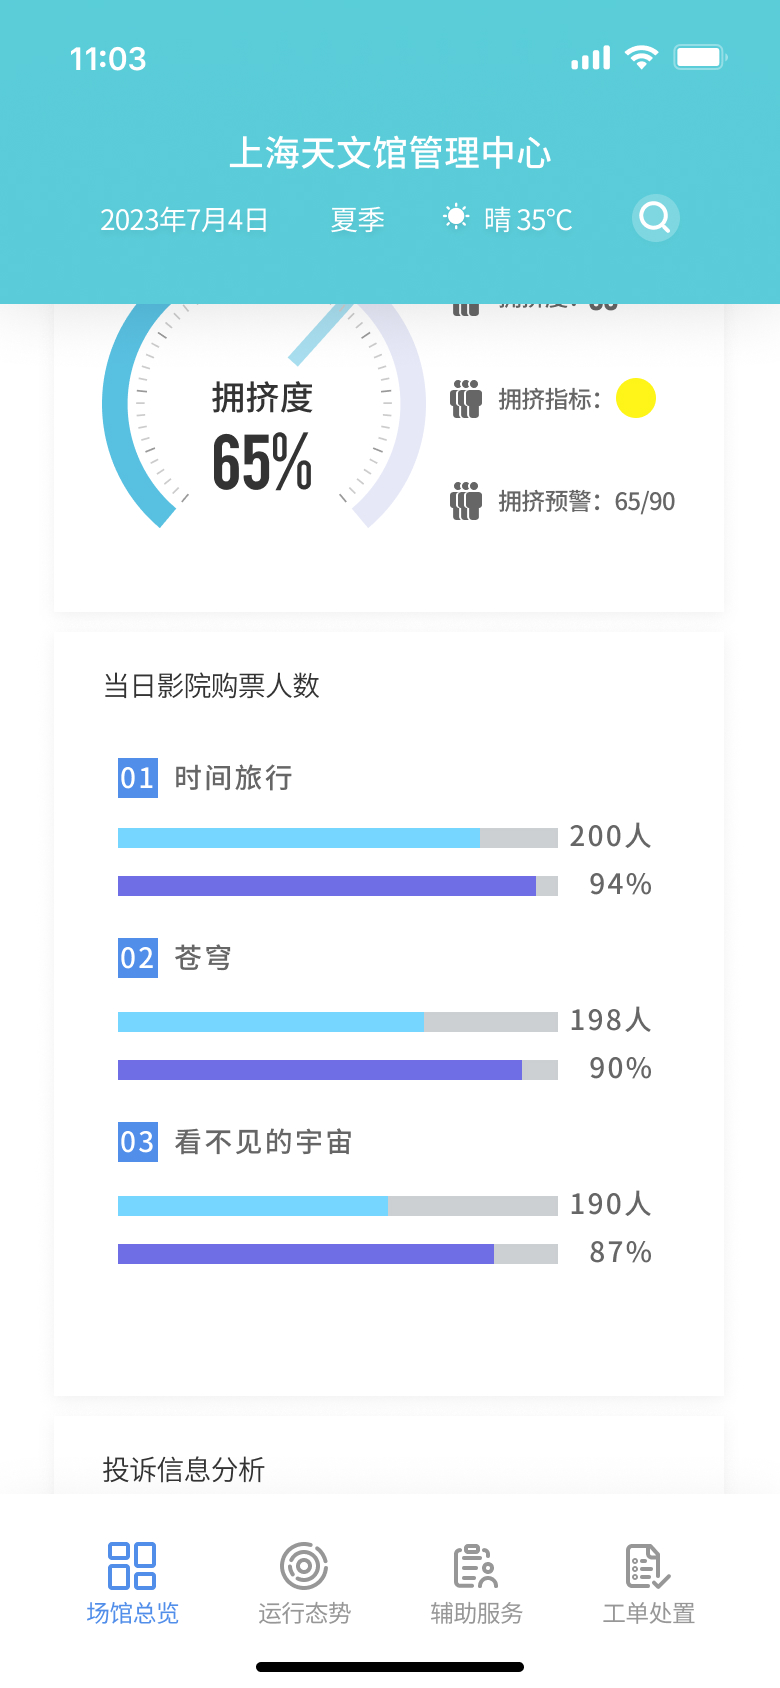
为不同数据匹配不同的可视化方式
Right Visualization for Each Data Type
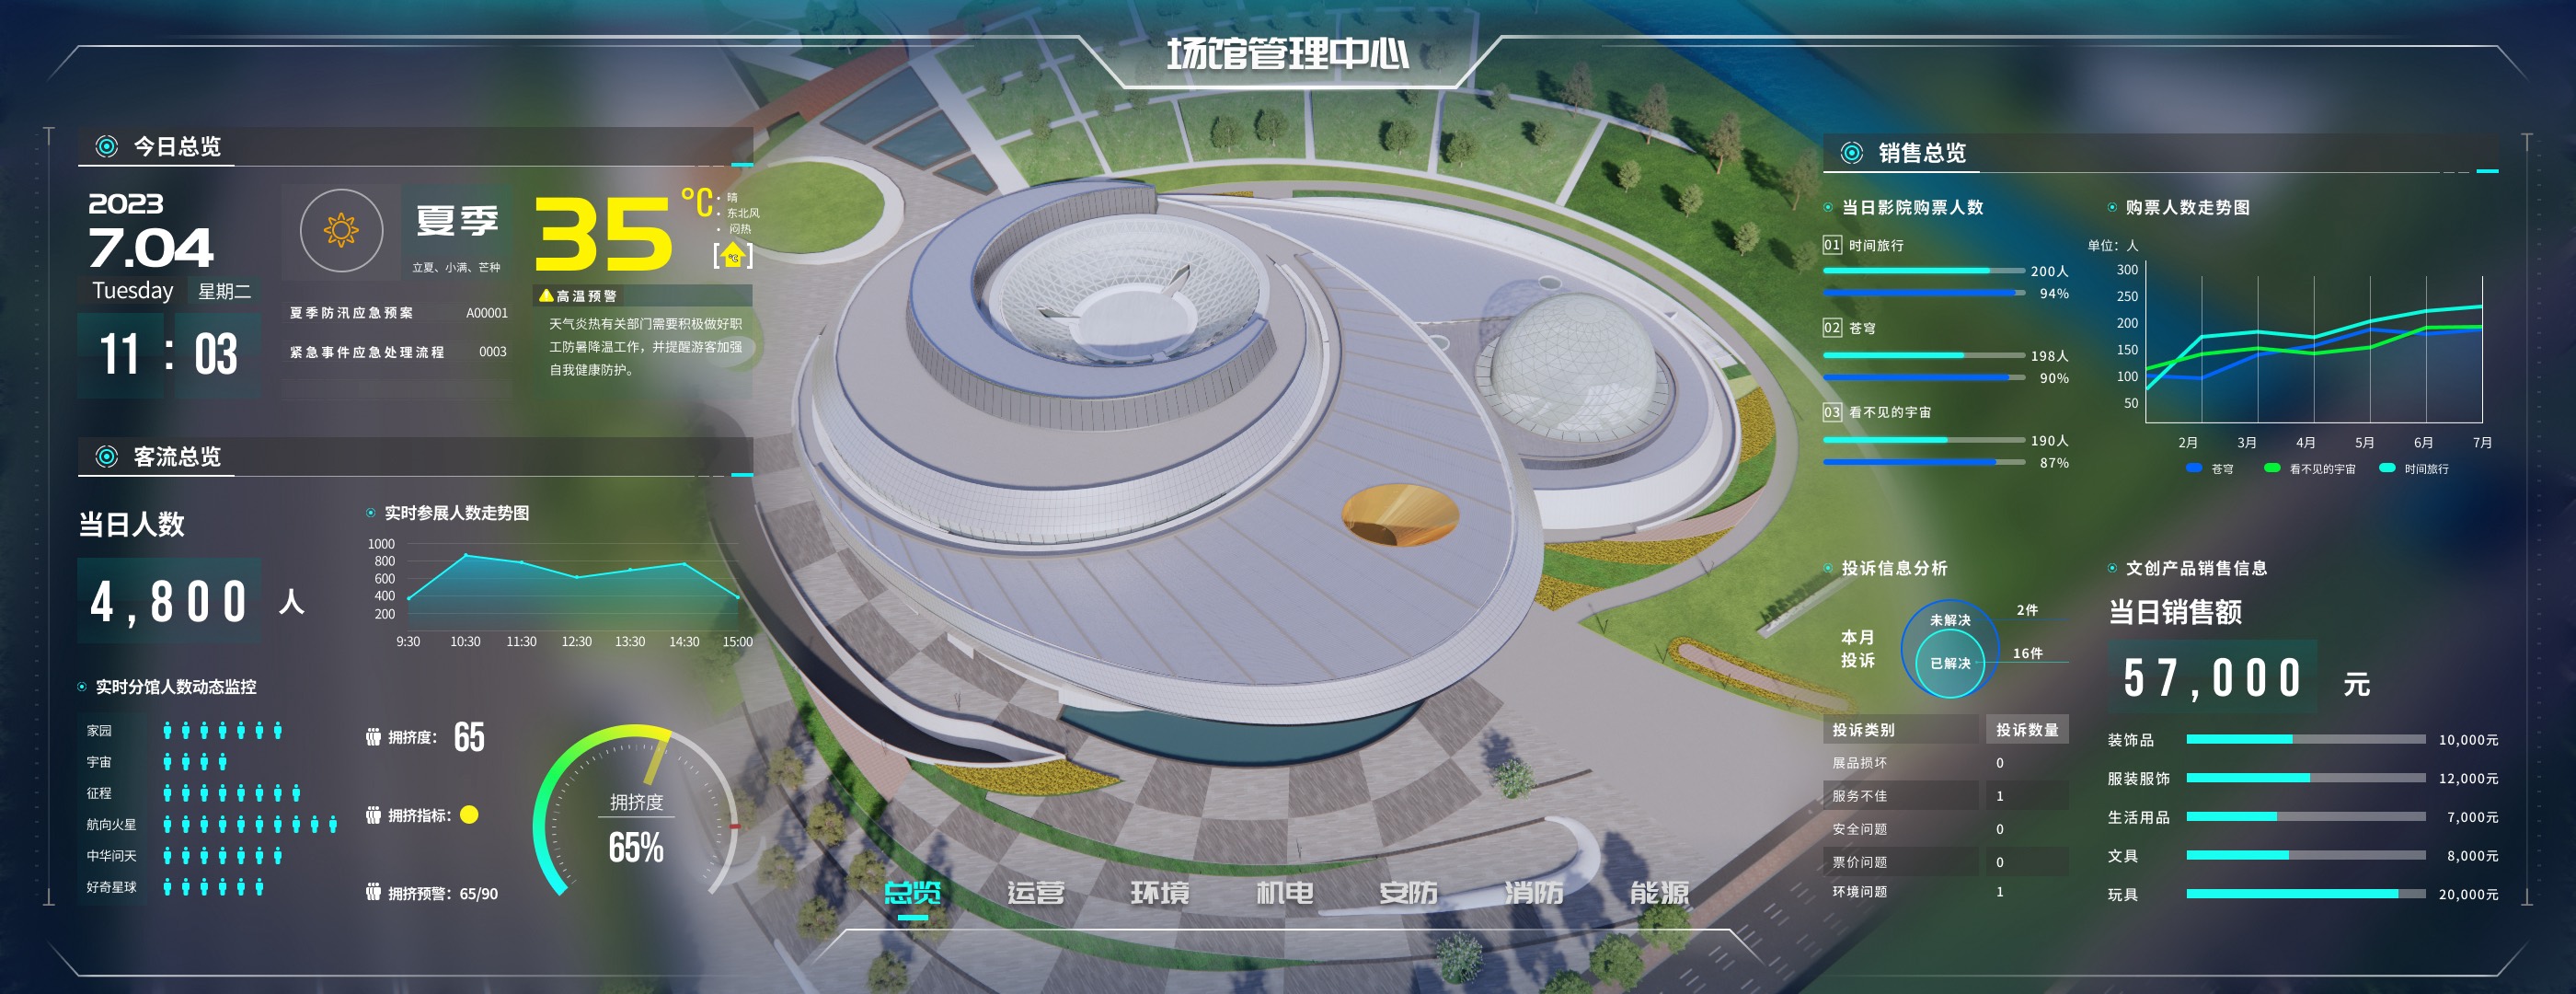
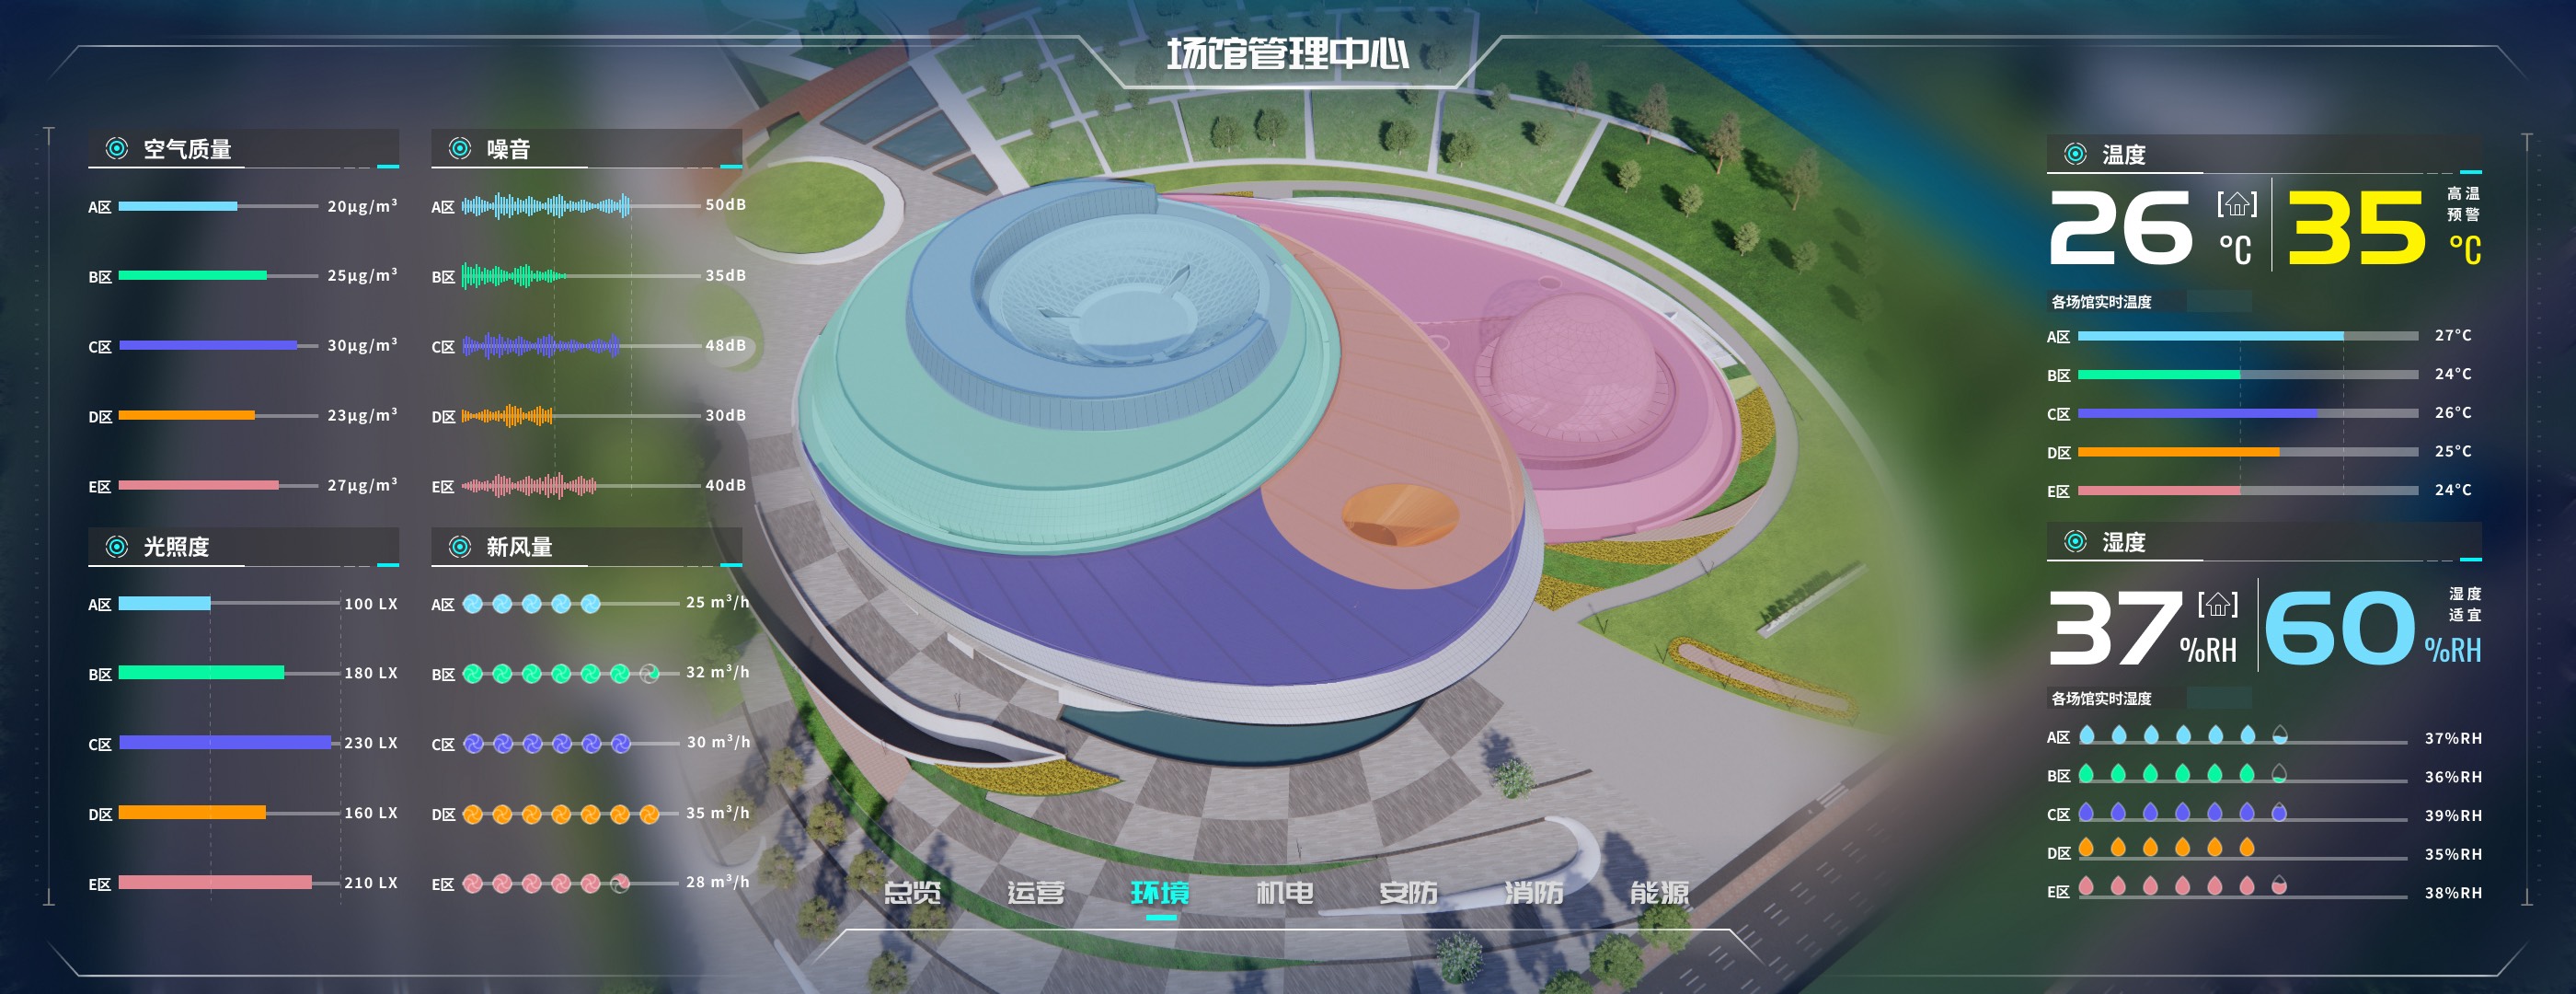
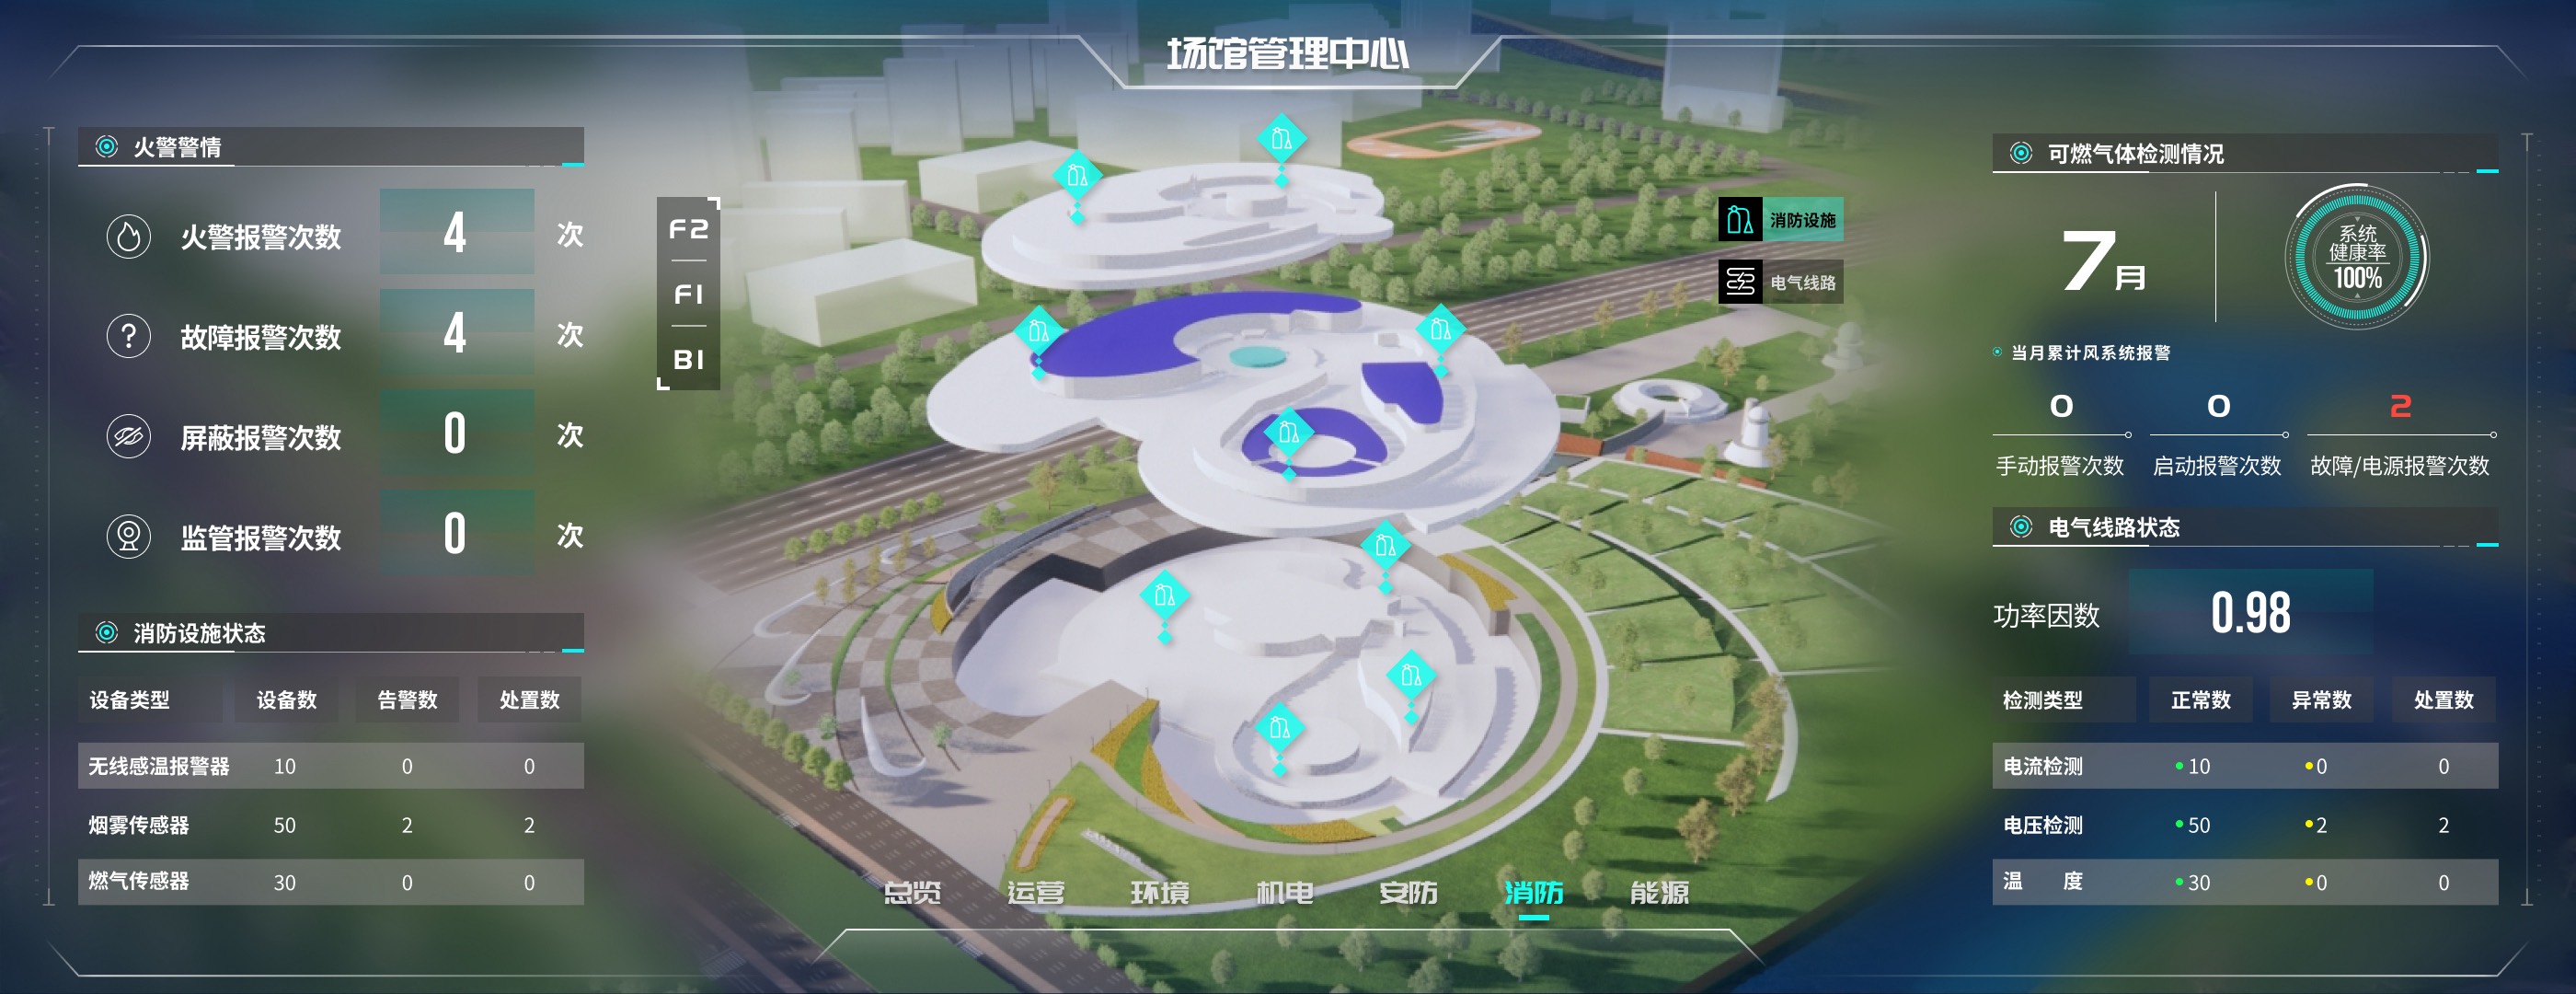
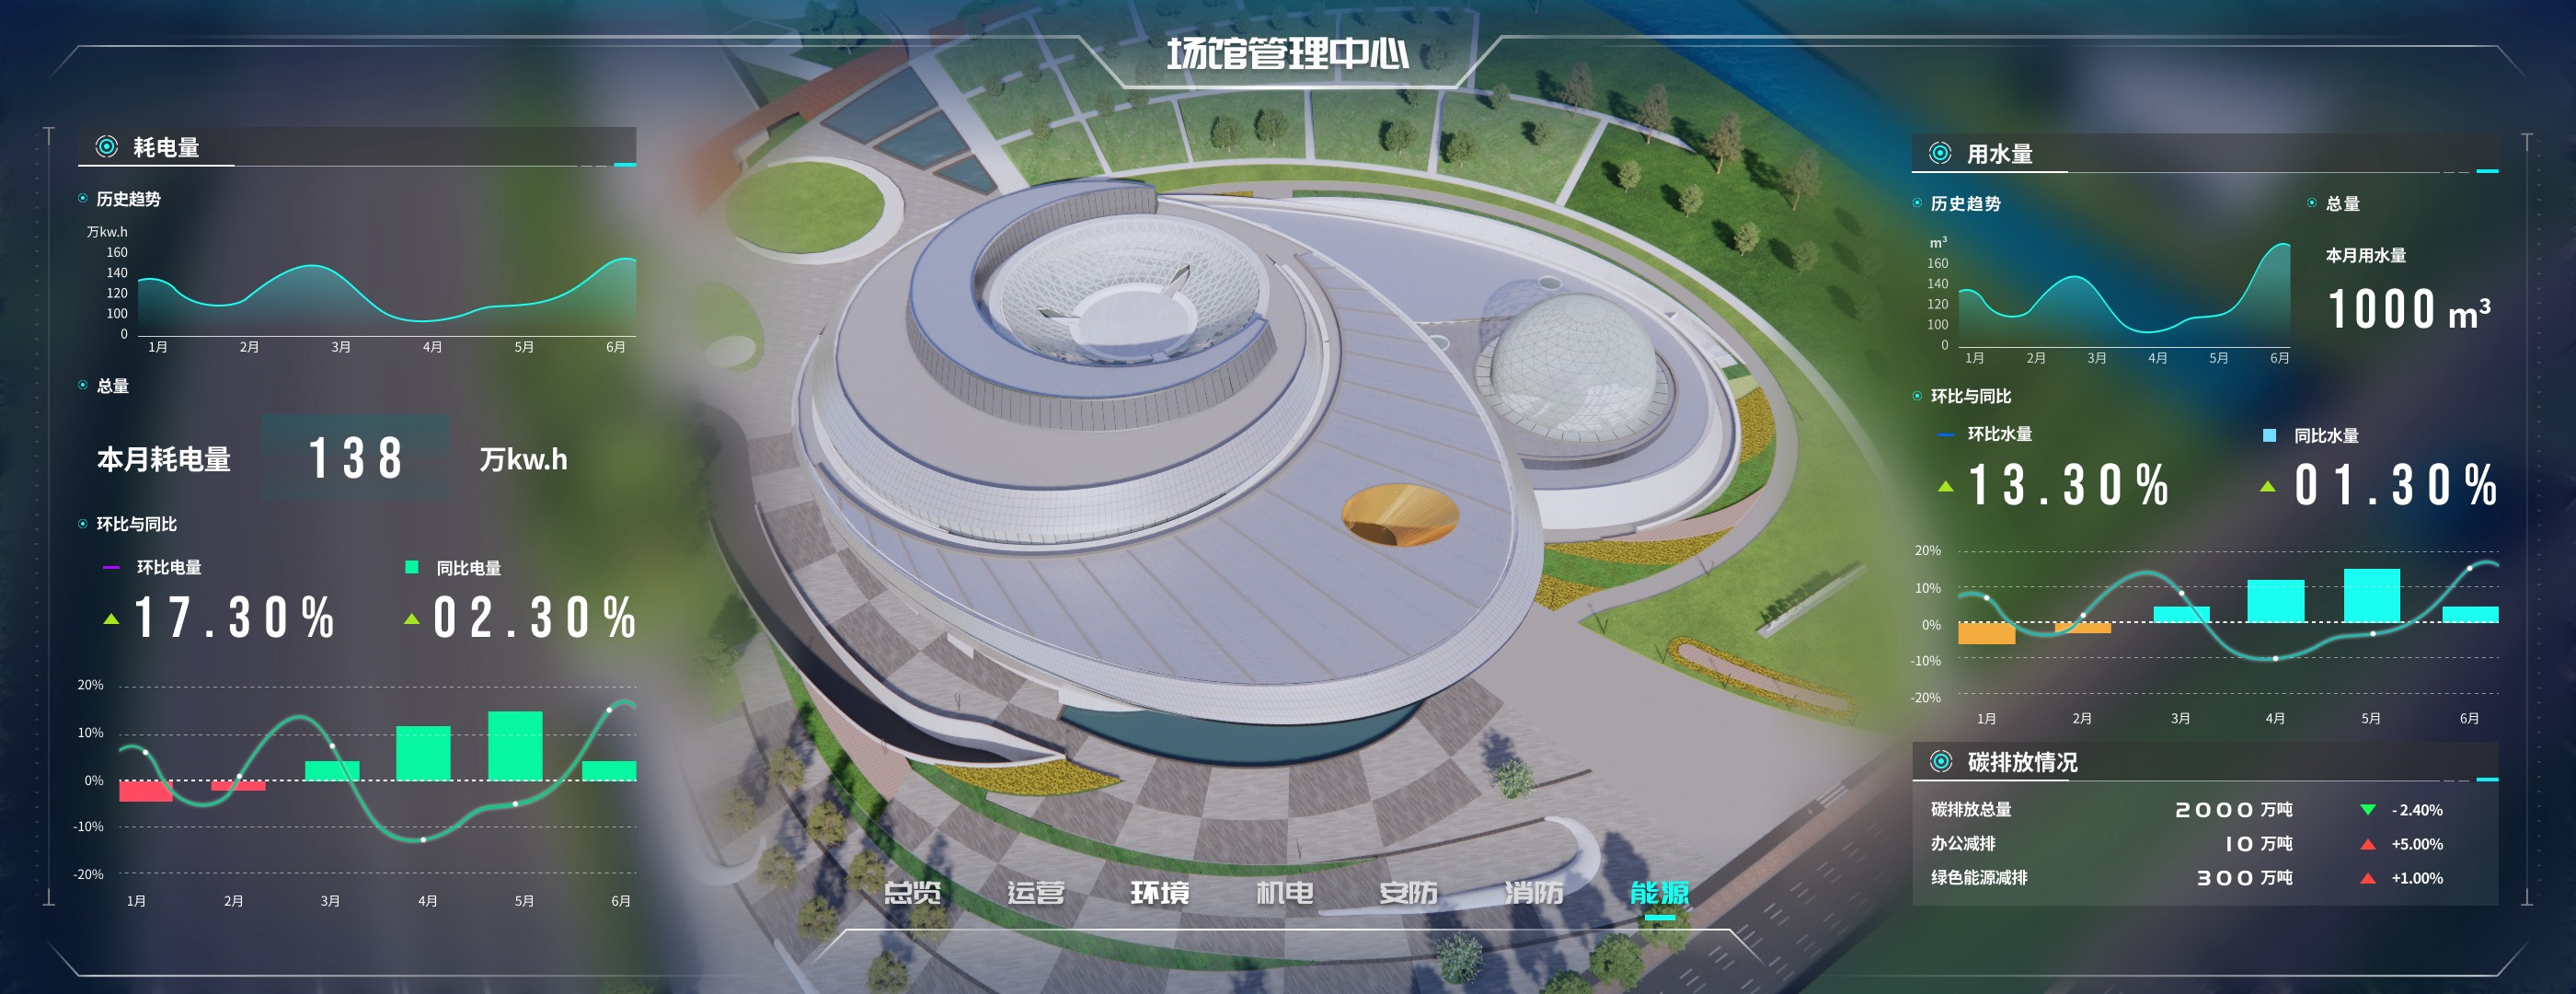
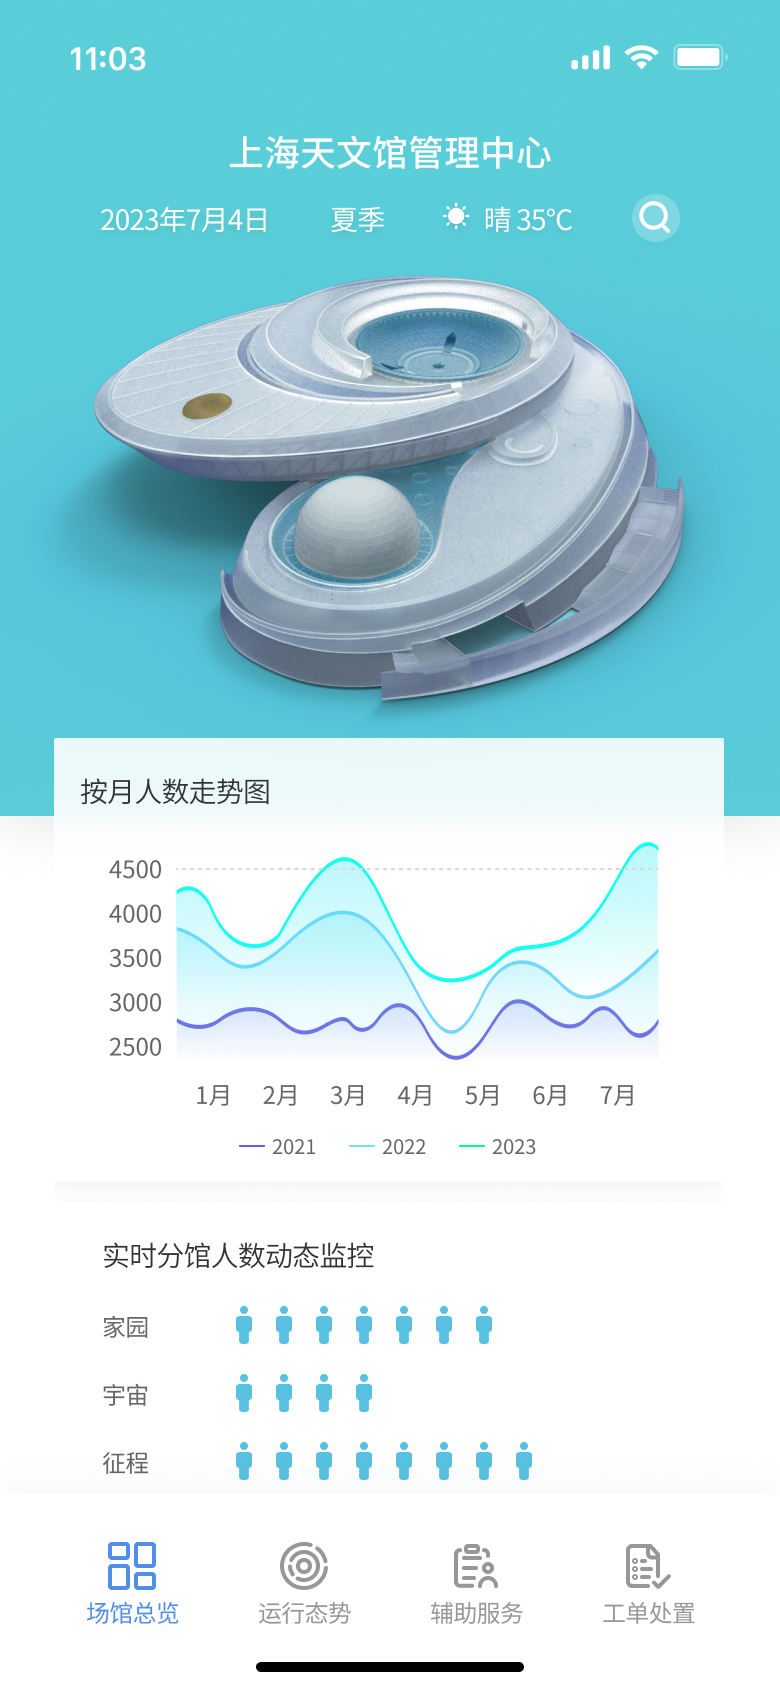
趋势用折线图,占比用环形图,状态用色标表格,空间分布标注在 3D 模型上。每个模块的数据性质差异很大,需要对应的可视化方式。
The 7 modules each deal with fundamentally different data: visitor trends, sensor readings, alarm events, equipment status, energy comparisons. Rather than applying one template, I matched each to its best-fit visualization: line charts for trends, ring charts for proportions, color-coded tables for status, annotated points on the 3D model for spatial distribution.
03
大屏场景下的视觉层级
Visual Hierarchy for Large Screens
大屏观看距离远,关键数字需要大字号和高对比度确保第一时间被捕捉。明细信息用较小字号和低对比色退到第二层级。
The dashboard is viewed from several meters away, so you can't read it like a webpage. Key metrics (4,800 daily visitors, 1.38M kWh monthly electricity) need oversized typography and high contrast. Secondary details like device logs and event tables recede with smaller type and muted colors. The dark background also required careful color calibration.
04
左右对称布局
Symmetrical Layout for Scanning
大屏视线先看中间再往两边扫。中间始终是空间概览,两侧始终是数据面板,切换模块时不需要重新适应。
On a large screen, the eye naturally goes to the center first, then out to the sides. Center is always the spatial view, sides are always data panels. Switching modules doesn't require relearning the layout. The two sides also naturally separate data dimensions: electricity vs. water for Energy, device stats vs. personnel events for Security.
05
7 个独立模块,平衡信息量与认知负荷
7 Focused Modules vs. One Dense Screen
运营、环境、安防等领域几乎没有交集,全部放在一个页面会远超可读极限。拆成 7 个模块后,每个只聚焦一个维度,总览页作为汇总入口。
Operations, environment, security, mechanical, fire, and energy are fundamentally different domains with little overlap. Combining them on one screen would exceed readable limits. Seven modules, each focused on one dimension with a shared navigation bar, balance completeness against cognitive load. The Overview page serves as the consolidated entry point.